All research

Research · cobuy.io/co-ownership-index

CoBuy Co-ownership Index™

Industry first Research2026

We turned five years of research into one maintained page of numbers anyone can cite.

ProofOur model puts co-buying at 31.5% of US home purchases in 2026.
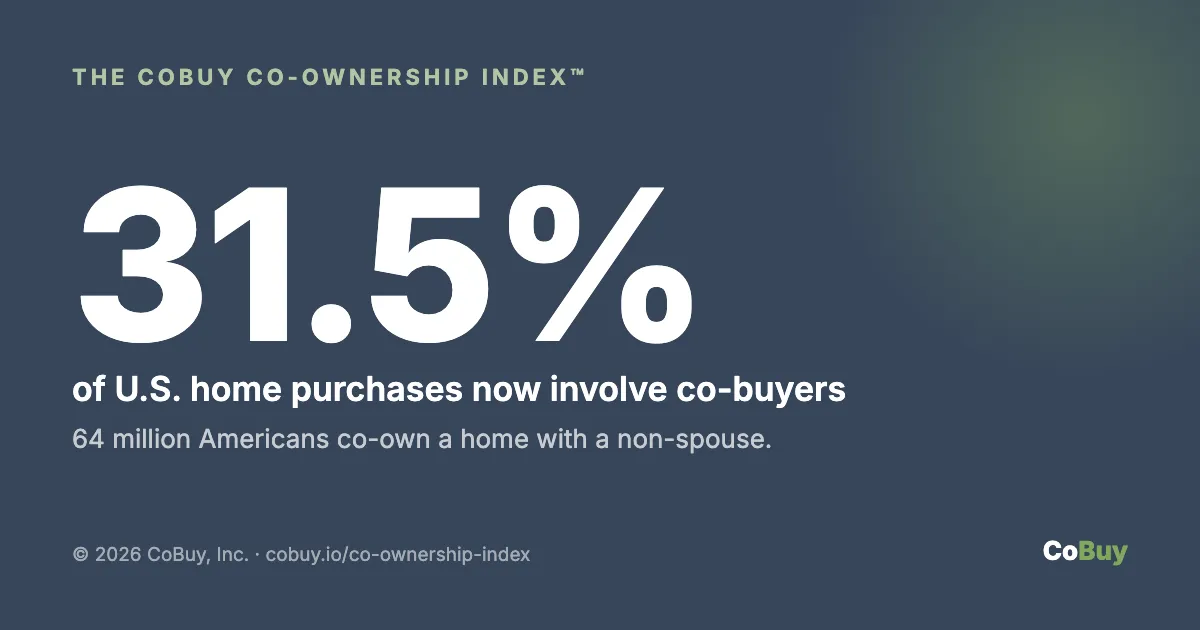
The CoBuy Co-ownership Index title card, reading 31.5% of US home purchases now involve co-buyers

My role

Designed the model and the page. Published it.

Results

  • One address for the category’s headline numbers.
  • Our model estimates 64 million Americans co-own a home with someone they aren’t married to.
  • Built to be quoted. The method is on the page.

What it is

A report is a moment. People kept asking for the current number.

The CoBuy Co-ownership Index™ is the standing answer. It combines our survey data with Census and mortgage-market data, shows the trend, and explains the method.

It’s for journalists, analysts and professionals who need a number they can source.

Charts
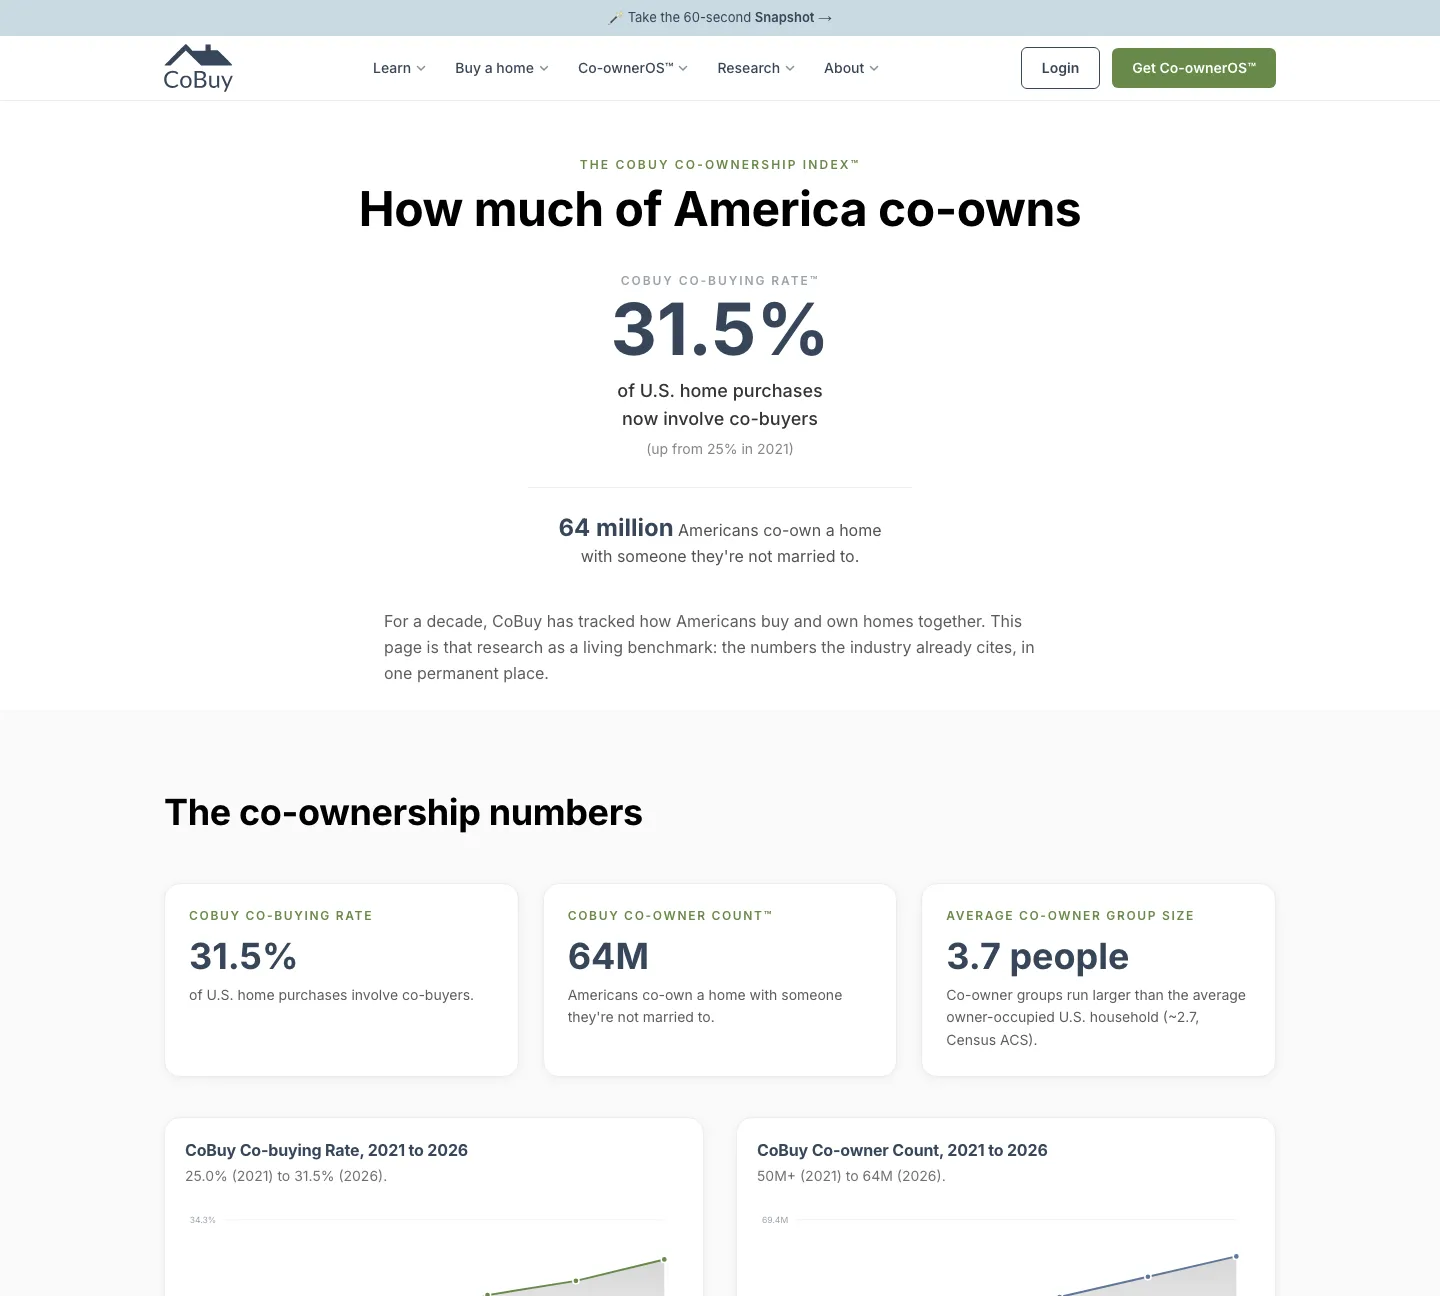
The Co-ownership Index page, with headline figures and trend charts
The page. Headline numbers, the trend behind each, and how we got them.
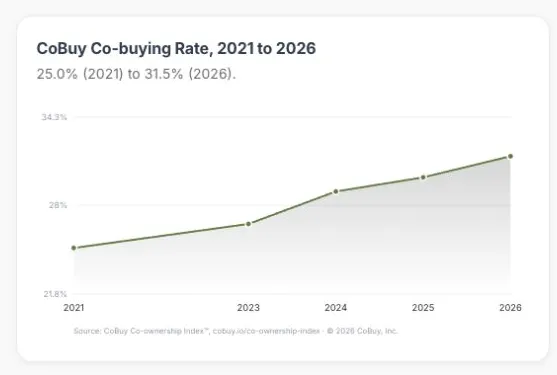
A line chart of the CoBuy Co-buying Rate rising from 25.0% in 2021 to 31.5% in 2026
The co-buying rate, 2021 to 2026. 25.0% to 31.5%.
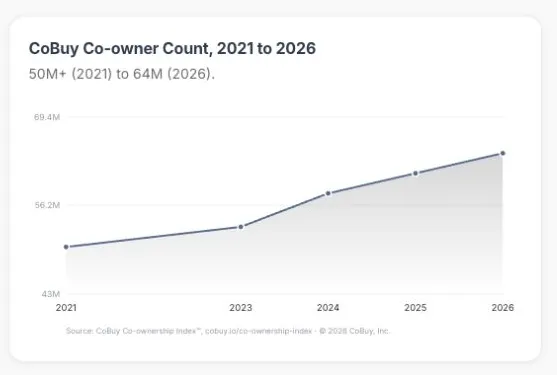
A line chart of the CoBuy Co-owner Count rising from 50M+ in 2021 to 64M in 2026
The co-owner count, 2021 to 2026. 50M+ to 64M.
The methodology section, explaining the Index is a triangulated estimate anchored to Census and mortgage data and a decade of CoBuy research
The method, on the page. An estimate anchored to federal data, disclosed as an estimate.
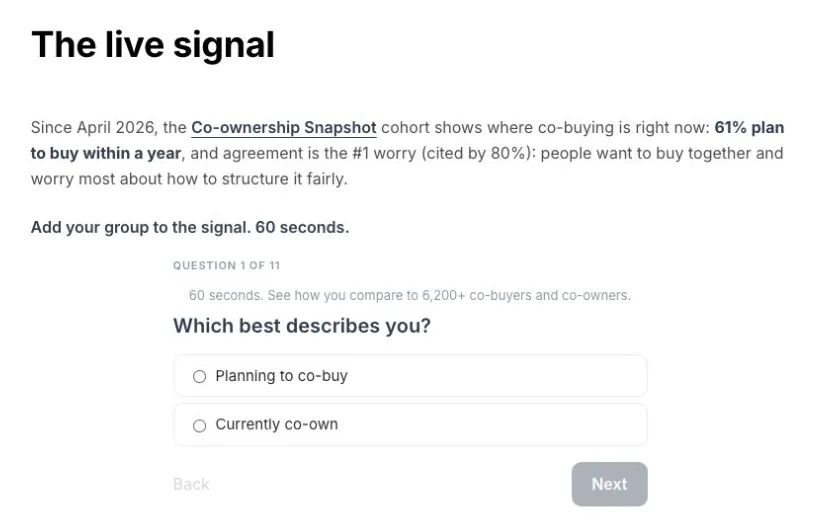
The live signal section, with a short survey asking whether you plan to co-buy or currently co-own
The live signal. A 60-second survey that keeps fresh answers coming in. Its percentages describe respondents, not the nation.

Related work

See the Index All research

Full size